
We aim at a broad study of agro-environmental planning.The program area include: (1) elucidation and development of methods to manage material cycles and energy dynamics, (2) development of management methods for agro-ecosystems, and (3) evaluation and control of the impacts of agricultural production on global change. A project started from this year aims to develop macro-indicators to evaluate objectively the relationship between agricultural activities and the environment. Four laboratories in our division are participating in this project to develop macro-indicators of soil erosion,greenhouse gas emission, biodiversity and landscape. There are 5 projects funded by the Environmental Agency, one project funded by the Science and Technology Agency, and 3 projects funded by MAFF, other than that described above. In 1996, 4 foreign scientists visited our division, and 7 scientists in our division participated in international conferences and 4 scientists went abroad on official business.
Topic1
Evaluation of Water Conservation Function using a Geographical Information System
For environmental planning, the influences on the environment by land use, planning of facilities, and/or introduction of new technologies should be first estimated, and then the appropriateness of these factors must be verified. To achieve these goals it is necessary to construct models for estimation and evaluation using a geographical information system.
We developed a runoff model for estimating daily water movement within a small basin (18km2) based on measured rainfall and runoff data and geographical information, such as the soil water retentivity, landforms,runoff and soil water storage resulting from changes in land use were estimated,and the water conservation function of basins was evaluated. The model basin was divided into grid cells (25m * 25m), and runoff and water retention were calculated for each cell using a model shown in Fig.1. Runoff is mainly affected by soil type and land use,because soil depth and pores cause changes in water retentivity and permeability.
Also,land use change affected the rates of rainfall interception, evapo-transpiration and infiltration. First, the water holding capacity distribution was estimated from capillary water retention (pF1.7-2.7) shown in Fig.2. The water holding capacity of the whole basin was 187 mm. And the daily runoff discharge and storage quantities in a basin through the year were estimated from observed daily rainfall using this model.
Next,the change in soil moisture storage was calculated under the alternative assumption that upland fields and orchards were converted to residential areas (Fig.3).
The tested day had the smallest discharge during the non-irrigation period. As a result,it was assumed that the entire storage quantity per area of modified land on such a day would be 27.6 mm lower, and the runoff discharge would be 0.22 mm/day lower.
Topic2
Database System for Estimating Nutrient Flow in Regions
Sustainable agriculture has been discussed extensively from various points of view. One indicator of sustainability is the nutrient balance (balance between input and output of nutrients) in cultivated lands. But even if nutrient balance in cultivated land is known, other problems such as non-utilized livestock waste (not applied to cultivated land), exist in rural areas. Therefore, sustainability and nutrient balance have to be estimated not only in cultivated land, but also throughout the region.
For this purpose,we employed a model for organic matter flow in a rural ecosystem (Fig.4) and constructed a data base to estimate and evaluate nutrient flow in large regions (prefectures and municipalities) in Japan.
Using this database,two indices (nutrient balance in cultivated lands and non-utilized livestock waste) were calculated in each of the 47 prefectures (Fig.5, Fig.6).
Reduced chemical fertilizer input along with the greater application of residual livestock waste is needed for reducing these two indices and increasing sustainability. This database also can be used for estimating how these two indices change when agricultural practice substitutes manure for fertilizer.
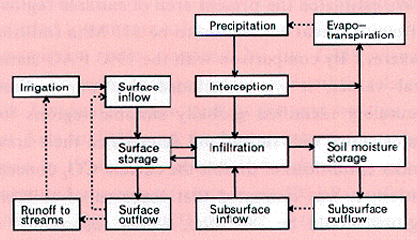
Fig.1 Water flow in a grid cell
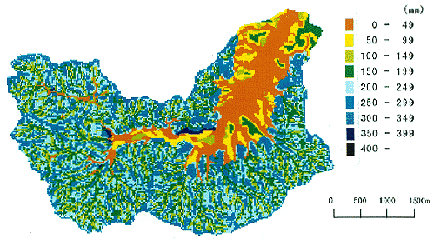
Fig.2 Soil moisture strange capasity (pF 1.7-2.7)
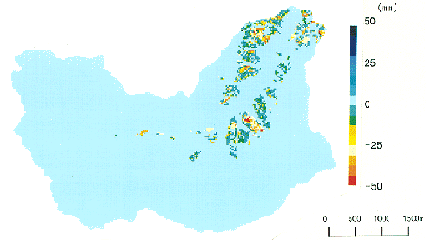
Fig.3 The balance of soil moisuture storage between actual and supposed land use (Feb.14.1991)
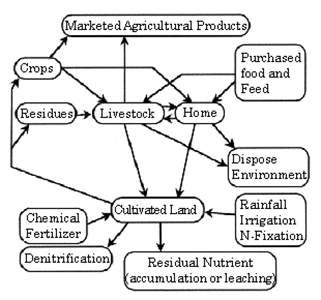
Fig.4 Structure of the model for nutrient flow in a region
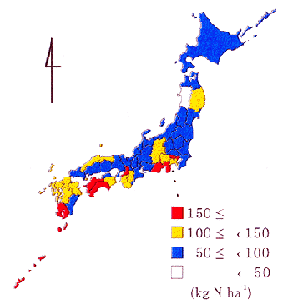
Fig.5 Residual nitrogen in cultivated land
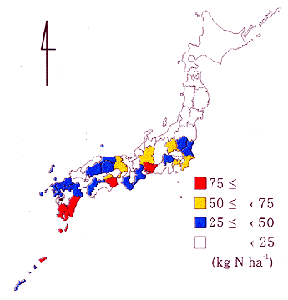
Fig.6 Non-utilized livestock wastes