The Johannesburg Earth Summit in 1992 sounded alarm bells all over the
world about the importance of global-scale environmental conservation for
sustainable human existence. To deal with the current worrying situation, a series
of international pacts on global warming have been concluded among the member
countries of the IPCC (Intergovernmental Panel on Climate Change) and UNFCCC
(United Nations Framework Convention on Climate Change). In addition,
great efforts are being made internationally and nationally to monitor and
assess greenhouse gas emissions, understand the vulnerability of ecosystems,
and develop mitigation techniques.
In light of these efforts, the mission of the Department of Global Resources
is expressed by 2 broad global environmental research goals: to assess the
agro-ecological impacts of unusual climatic variations and global warming;
and to develop adaptive technical and policy measures to reduce any adverse
impacts by clarifying climate-change mechanisms and by monitoring and modeling. These
missions are the concern of 2 research groups - the Agro-Meteorology Group
and the Ecosystems Group - and 3 teams - the Greenhouse Gas Emission Team,
the Food Production Prediction Team, and the Ecosystem Gas Exchange Team.
Research has been initiated in domains such as: 1) prediction of food production
under global environmental variability; 2) elucidation of the impacts of global
climate change on agro-ecosystems; 3) estimation of greenhouse gas emissions
from agricultural activities and development of measures to minimize emissions;
4) determination of the effects of human activity on the flow of carbon and
nitrogen; 5) development of techniques for remote sensing and multivariate
statistical analysis; and 6) assessment of changes in rural land use.
To achieve these research goals efficiently we introduced a new strategic
structure in 2002. The Council of Science and Technology Policy of the
Cabinet Office released its "Promotion Strategy for Priority Fields" in September
2001, in accordance with the "Basic Plan for Science and Technology," which
is now in its second term. (It runs from fiscal years 2001 to 2005.) The
Council of Science and Technology Policy has organized "Research Initiatives" in
the field of environmental studies.
The Department of Global Resources at NIAES participates mainly in the
Global Warming Research Initiative. To acquire scientific knowledge on the effects
of anthropogenic emission of greenhouse gases on climate change, a new project
entitled "Elucidation of global warming impacts in agriculture, forestry and
fishery and development of mitigation techniques" was financed in 2002. The
goals of this project are a) to assess feasible changes that can be made in
agricultural, forestry, and fisheries production; and b) to establish comprehensive,
integrated measures to mitigate greenhouse gases emissions and stabilize climate
change within a range acceptable for human civilization.
Comprehension and integration of individual products are particularly important
in this area, because the formation of a unified model is indispensable to
the prediction of our future climate, assessment of the impact of climate change,
and institution of the appropriate political, economic, and technological measures.
|
| 1) Agro-Meteorology Group |
The mission of the Agro-Meteorology Group
is to clarify predictions of the impacts and atmospheric changes in agricultural
ecosystems caused by climate change and elevated atmospheric CO2 levels. The
Agro-Meteorology Group consists of 3 units: 1) Climate Resources Unit, 2)
Atmospheric Impacts Unit, and 3) Air Quality Conservation Unit.
The research aim of the Climate Resources
Unit is to develop monitoring techniques for evaluating climatic resources,
to construct a reliable database for evaluating the effects of climate change
and elevated CO2 on agricultural water resources, and to develop methods
for predicting these changes. The
research objective of the Atmospheric Impacts Unit is to develop models for
predicting the effects of elevated atmospheric CO2 on agricultural ecosystems
by analysis of the results of free air CO2 enrichment (FACE) experiments. The
research of the Air Quality Conservation Unit is focused on clarifying the
processes of emission, diffusion, and deposition of air components such as
trace gases, pollens, and dust in agricultural ecosystems.
In FY 2002, the following research was conducted by the 3 units: 1) understanding
and predicting of spatio-temporal change in agricultural water resources,
2) assessment of the impact of climate change on agricultural production,
3) study of a model for estimating regional paddy water and soil temperatures
by using routine weather data, 4) impact assessment of climate change from
the viewpoint of agricultural production management, 5) prediction of the
impacts of atmospheric CO2 increase on crop production and water use, 6) process-based
modeling of agricultural ecosystems under rising temperatures and atmospheric
CO2 concentration, 7) impacts of increasing atmospheric CO2 on heat stress
in crop plants, 8) modeling and simulation of canopy microclimate and fluid
dynamics for developing open-air warming systems, 9) modeling and estimation
of emission and diffusion processes controlling air quality in agro-ecosystems,
10) examination of the relationship between ground surface conditions and
eolian dust outbreaks, 11) assessment of temporal and spatial variations in
the bio-meteorological environment on alpine grassland ecosystems, and 12)
assessment of the climate mitigation function of agricultural land.
The 19th Meteorology Workshop, entitled "Carbon and nitrogen cycling in
terrestrial ecosystems under global environmental change: overview and perspective
of monitoring, experimenting with, and modeling of ecosystem processes" was
held at NIAES on 25 February 2003. Thirteen original papers and 1 review
were published in international and domestic journals in 2002. From
24 March 2002, Dr. S. Yonemura visited the Max -Planck Institute for Chemistry
in Germany for 18 months to study the exchange of trace gases between the
biosphere and the atmosphere.
Topic A: A dynamic water model for evaluating
agricultural water resources on a continental scale
The time has come for us to evaluate
how much of our water resources we are using for agriculture. To assess our agricultural water resources
we must examine not only the available precipitation but also the availability
of water from other sources for irrigation. To determine the latter,
we must develop an understanding of water dynamics on a continental scale,
of which river discharges are among the most important components. In
this context, we attempted to construct a simple water dynamics model to calculate
the amount of water discharged from river basins and to evaluate water requirements
for irrigating croplands throughout East Eurasia.
To minimize geographical inconsistencies
between actual drainage basins and those defined by coarse grids and to represent
natural water flow controlled by the topography, the model based on small
drainage basins were used. The
model consists of a runoff sub-model and a river flow sub-model. The
former estimates the amount of runoff from basins, and the latter represents
the lateral movement of water through the network of river channels. In
the runoff sub-model, independent calculations were made for each of 6 land-cover
categories. Limiting parameters of soil water condition and seasonal
changes in vegetation cover, which are expressed by seasonal variation of
Normalized Difference Vegetation Index, were introduced in the runoff sub-model. Evapotranspiration
was expressed as the sum of evaporation and transpiration, both of which were
calculated by the FAO-56 method. By this method, crop water requirement
was estimated as the deficit of the actual transpiration against the transpiration
without water stress. In the river flow sub-model, the amount of runoff
from each stream was calculated by accumulating the values from the actual
area of the present basin and the flow from the upper streams.
The model simulation was performed using
CRU-TS2.0 dataset (Mitchell et al, 2003). This is a global historical monthly climatic data, which
were constructed at a 0.5-degree resolution from 1901 to 2000, and then the
annual discharge of each stream was estimated by the model (Fig.
1). We
used GRDC and IHP/UNESCO discharge data from observations at 118 selected
gauging stations on several main rivers for validation of the simulated discharges. In
many cases, we found that the model tended to underestimate the discharge
in comparison with the observations. This tendency seemed more obvious
in areas with sparse vegetation, thus indicating that the model tended to
overestimate evaporation from bare soil. (Y. Ishigooka)
Topic B: Estimating the first day of Japanese
cedar pollen release under global climate change
The pollen of Japanese cedar (Cryptomeria
japonica) causes hay fever and is a major problem in Japan. Global warming is likely to worsen the
problem, but there have been few predictions of the extent of this worsening. We
examined the effects of snowfall on the day of initiation of Japanese cedar
pollen release, and predicted changes in this day under global climate change. We
used a statistical method to investigate how much sooner pollen release would
start, using data on predicted meteorological conditions under global warming
in the city of Yamagata.
We performed a single regression analysis
using the day of initiation of pollen release in Yamagata as the dependent
variable and the mean January-February temperature as the independent variable,
and obtained the following regression equation with a contribution ratio
of 0.63:
Y = -7.40X1 + 66.63 (1),
where Y is the first day of the year
(DOY) on which pollen is released and X1 is the January-February mean temperature
(°C). We then performed
a multiple regression analysis using temperature and monthly snowfall depth
as independent variables. Adding snowfall depth improved both the degree-of-freedom-adjusted
contribution ratio and the estimation error over estimates that used only
January-February mean temperature as the independent variable. When
only February data were used for snowfall depth, the degree-of-freedom-adjusted
contribution ratio rose to 0.79, the best result. For this reason we
chose the following multiple regression equation using January-February mean
temperature and February snowfall depth as independent variables to estimate
the day of initiation of pollen release:
Y = -5.65X1 + 0.13X2 + 55.46 (2),
where X2 is the February snowfall depth (cm).
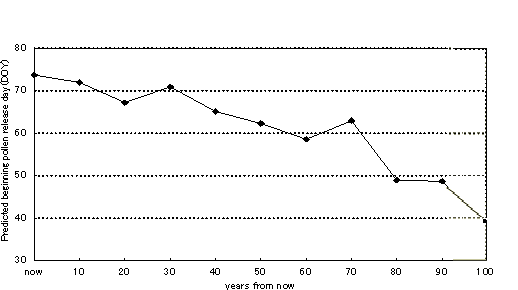
We verified the equation by plugging
the meteorological data for Yamagata from 1983 to 1998 into Equations (1)
and (2) (Fig. 2). The close fit
of the equation predictions to the experimental data shows that adding snowfall
depth yields more accurate estimates of the first day of pollen release than
using air temperature alone, thereby making possible estimates with an error
of within 5 days. Under the predicted global climate change, we expect
the first day of pollen release to become earlier in Yamagata (Fig.
3). The
date would be 8 February in approximately 100 years' time, compared with 20
February (at the earliest) now. Eighty years from now the date could
be earlier than any date recorded so far. (S. Inoue and S. Kawashima)
|
| 2) Ecosystem Group
|
The Ecosystems Group consists of 5 units. The Material Ecocycling
Unit is studying the nitrogen and nutrient flow in agro-ecosystems
to evaluate the relationship between anthropogenic activities and material
cycles in Japan and East Asia (see Topic 2). The Ecological Management
Unit is studying historical changes in the spatial structure of rural
ecosystems, and the conservation and management of the wildlife that
inhabit rural environments of the Kanto District. The Remote
Sensing Unit has been determining environmental characteristics that
can be observed at a regional scale through satellite imaging such
as multi-band and multi-polarization SAR, NOAA/AVHRR, and TERRA/MODIS. The
Agro-Ecological Sensing Unit is developing remote sensing and modeling
methods for monitoring plant and environmental dynamics in agricultural
and natural ecosystems based on optical and electromagnetic measurements
ranging from leaf scale to regional scale. The Statistics Unit
is developing novel statistical methodologies for sampling, classifying,
and analyzing agro-environmental data (see Topic 1). In FY 2002,
we carried out 8 research projects funded by the Ministry of the Environment,
MEXT, and MAFF. Our researchers attended 8 meetings abroad related
to anthropology, ecology, remote sensing, and statistics, and 2 researchers
participated in OECD expert meetings on biodiversity and remote
sensing. Further, researchers made 6 overseas visits - to the
United States, France, China, Korea, Laos, and Thailand - for field
work and cooperative projects. Domestically, we made a total
of 26 presentations at academic meetings on statistics, remote sensing,
geography, environmental sciences, and anthropology.
Topic 1: Estimating larger phylogenetic
trees for biodiversity studies
Analysis of biological diversity gives fundamental
knowledge for various branches of biology and agronomy. A taxonomic or species-based
database would be a useful tool for cataloguing the world's biota. However,
the construction of such a taxonomic database or inventory is not the
only task we need to undertake if we are to understand, maintain, and
recreate biodiversity. Taxonomic classification has intuitive
appeal to us as humans, because we like to catalog living things into
groups within groups according to the degrees of similarity of various
characters. However, such taxonomic groups or 'taxa' - species,
genus, family, and so forth - do not have explicit historical or evolutionary
implications. All organisms on Earth are the products of biological
evolution. Current states of biodiversity have their evolutionary
origin in the past, and if we are to maintain and control biodiversity,
we need to know its evolutionary history. If our research were
based on evolutionary biology, we would be able to obtain more definite
knowledge of the origin of biodiversity.
Estimation of the history of organisms ('phylogeny')
is one of the most rapidly growing fields of research in evolutionary
biology. It
is also a flourishing area of interaction between biology, statistics,
mathematics, and computer science. In the past the science of
phylogeny ('phylogenetics') was denigrated as mere speculation driven
predominantly by the action of bold imagination on scant empirical
data. However, because of the growing accumulation of molecular
biological data (DNA or amino acid sequence data) and methodological
advances in phylogenetic biology over the past 40 years, we now have techniques
for estimating more reliable phylogenetic trees by using high-speed
computers. Recent advances in genome informatics have given rise
to the new interdisciplinary science of bioinformatics, and comparable
advances in phylogenetic reconstruction will open up the promising
field of phyloinformatics in the near future.
Phylogenetic reconstruction, whose purpose is
to find an optimal graph called phylogenetic tree from character data
(e.g., DNA sequences, morphology), has been faced with a serious problem
in computer science: "NP-completeness". A
computational problem of class P (polynomial) requires us polynomial
computing time proportionate to its size. On the
other hand the category of NP-complete problems are known to possess
the highest level of computational difficulty in terms of discrete
optimization because they require NP (nondeterministic polynomial)
computing time. NP-completeness implies exponential time for
resolving problems. The problem of finding optimal phylogenetic
trees was proven to belong to the NP-complete category in 1982. Its
computational difficulty can be understood intuitively from the fact
that phylogeneticists must make comparisons among alternative trees
whose number N is calculated by the formula: N = 1 × 3 × 5 × ... × (2n-3),
where n is the number of organisms under study. The tree space
for searching will rapidly magnify as n increases (e.g., N is more
than 34 million for n = 10). For this reason, a more efficient
heuristic algorithm is required to calculate larger phylogenetic trees
in a shorter time.
BOGEN is a new, more efficient program for calculating
the most parsimonious trees from molecular sequence data. The principal characteristic
of our program is that it incorporates a new heuristic search strategy
for building optimal initial trees using simultaneous subtree-connections. The
upper limit of the size of the data matrix is 10 000 organisms / 50
000 base pairs for the current version of BOGEN. From our benchmark
test, the computing time on a Pentium 4 (2.26 GHz) Windows PC is as
follows: for 500 organisms / 1000 bp, 50 s (initial tree) and 37 min
(branch-swapping); for 1000 organisms / 1000 bp, 220 s (initial tree);
for 5000 organisms / 1000 bp, 1 h (initial tree). Calculating
a 10 000-organisms tree requires, on the average, at least 30 h for
optimal initial tree reconstruction. In our comparisons so far
of optimal trees from BOGEN with those from PAUP* 4.0 (currently the
most popular software for phylogenetic reconstruction), BOGEN trees
have been consistently shorter lengths than PAUP* trees, even without
branch-swapping operations. We are now developing a branch-swapping
program for larger trees. Several examples are presented in the
following references for comparison of BOGEN with other parsimony programs.
References
Minaka N., Suemura T., Asano T., Yamamoto H.
and Machii K. (2003) BOGEN: A faster parsimony program for computing
larger phylogenetic trees. Paper presented at the 22nd Annual
Meeting of the Willi Hennig Society held at the New York Botanical
Garden, New York, 20--25 July, 2003.
[Abstract]
Minaka N., Yamamoto H., Asano T., Suemura T.
and Machii K. (2003) A more efficient heuristic algorithm for the
large phylogenetic Steiner problem. Cladistics 19: 157.
Topic 2: Estimation of nitrogen flow in the food production-supply
system of East Asia and its environmental effects
In Asia east of Pakistan, about 55% of the world's
population lives on 18% of the world's land area, cultivating 30%
of the world's farmland. Food
production has been increased to supply these people with adequate
food. As a result, the amount of nitrogen fertilizer consumed
in the region has increased more than 20 times from the 1960s to 2000. Currently,
yearly consumption of nitrogen is about 43.6 × 10⁶ t, or 53%
of world consumption, and nitrogen pollution of surface and groundwaters
is a serious concern.
We created a numerical model that predicts the
nitrogen load in East Asian countries, mainly from FAO statistics
(Fig. 4). Nitrogen
is added to farmland in fertilizer and by biological fixation from
crop cultivation, and is taken out of farmland by harvesting and consumed
as feed and food. We assumed that all crop residues, livestock
manure and meat and fish not used for food and feed are returned to
farmlands, and the balance of the nitrogen is discharged from the farmland
to the environment (NLf). All nitrogen used by humans is discharged
to the environment directly or through the sewerage system (NLw). We
also accounted for NOx emission due to energy production (NLe) and
emission from natural ecosystems (grasslands and forests) (NLn). The
nitrogen loads from these sources were distributed over a 0.5 × 0.5
degree grid according to the land use and population in each grid cell.
Estimated total nitrogen load in 1999 for the
study region (from 60 ° E to 150 ° E and 12 ° S to 60 ° N) was 77.9 × 10⁶ t (2.4
t km-2). NLf contributed the most (54%) to the total nitrogen
load, followed by NLw (21%), NLn (18%), and NLe (7%). Fig.
5 shows the spatial distribution of NLf , which ranged from 0.002 to 43.5
t km-2y-1. The maximum nitrogen load occurred around the east
coast of central China. Discharged nitrogen was assumed to infiltrate
through the soil, where a fraction was removed by denitrification and
organic matter accumulation, expressed as a first-order reaction whose
rate was a function of temperature and residence time. The surplus
nitrogen flows to the river and then to the sea. The estimated
nitrogen concentration in river water was extremely high in the area
near the east coast of the North China Plain because of the high nitrogen
load and low precipitation; the maximum concentration was 90.2 ppm. The
model was validated by measurements of river and groundwater in this
area, where nitrogen concentrations were over 100 ppm in some locations.
|
| 3) Greenhouse Gas Emission Team
|
Considerable attention has been paid to the likelihood of significant
changes in world climate due to increased atmospheric concentrations
of greenhouse gases (GHGs) in recent years. GHGs, such as carbon
dioxide (CO2), methane (CH4), and nitrous oxide (N2O), can absorb
thermal radiation from the surface of the earth and thus contribute
to the warming of the atmosphere. The Intergovernmental Panel on
Climate Change (IPCC) has reported that concentrations of atmospheric
GHGs and their radiative forcing have continued to increase as a
result of various human activities.
Agriculture contributes to over 20% of global anthropogenic GHG
emissions. In particular, 55% to 60% and 65% to 80% of total emissions
of CH4 and N2O, respectively, are derived from agricultural sources.
These GHGs are emitted to the atmosphere as a result of accelerated
turnover of carbon and nitrogen in agricultural soils and the surrounding
environment by increased input of fertilizer and other agro-materials.
This increased input also results in increased emission of nitric
oxide (NO) and ammonia (NH3), which are the precursors of acid rain,
and in pollution of rivers and groundwater by leaching of nitrogen
and carbon components. The Greenhouse Gas Emission Team studies emission
and absorption of these environmentally important gases in association
with different land uses and agricultural management. The activities
of the team are based on field measurements of GHG exchange, laboratory
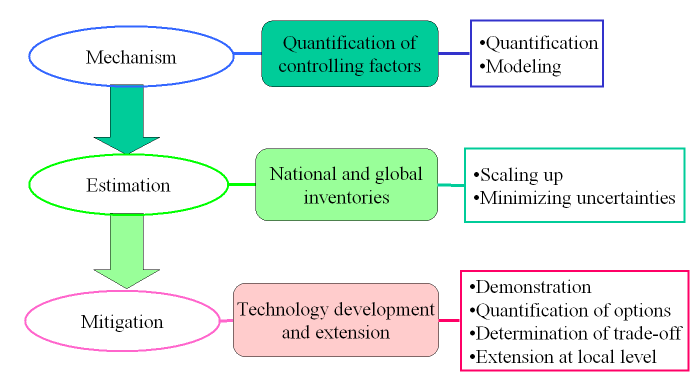
experiments, data interpretation, and modeling. The goals of the
team are: 1) to quantify and model the processes of GHG emission
and absorption, 2) to estimate the rates of GHG emission and absorption,
and 3) to develop promising and feasible technologies that reduce
GHG emissions (Fig. 6). The studies have been developed to address
scientifically and socially important questions related to the environmental
impacts of agriculture.
Topic: Methane and nitrous oxide emissions
from agricultural and natural ecosystems in China: studies in collaboration
with Chinese institutes
Because of China's huge land area and rapid economical development,
it is very important to assess the effects of land-use and its change
in China on the biogeochemical cycles of GHGs. In addition, there
is a research need to develop options for the mitigation of GHG emissions
from agro-ecosystems.
In this light, the Greenhouse Gas Emission Team has been studying
CH4 and N2O emissions from agricultural and natural ecosystems in
China, in collaboration with 2 research institutes of the Chinese
Academy of Sciences: the Institute of Soil Science (ISS) in Nanjing
and the Institute of Applied Ecology (IAE) in Shenyang (Fig.
7).
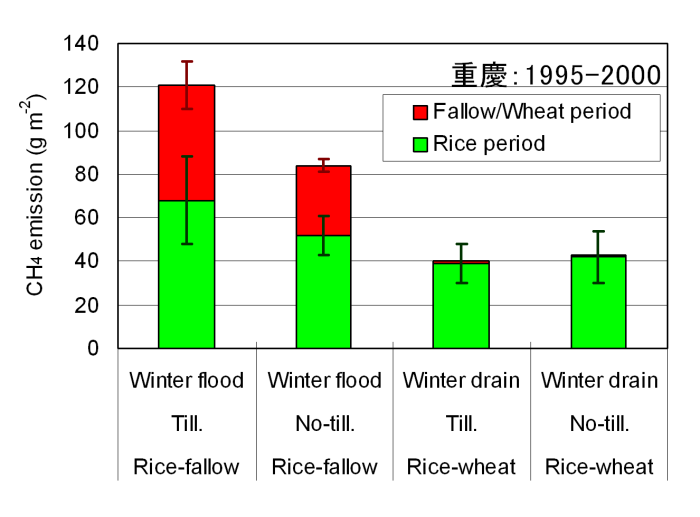
The collaborative study with ISS focused on the development of technologies
to mitigate agricultural CH4 and N2O emissions in the Changjiang
(Yangtze) valley. A field experiment in Chongqing, Sichuan Province,
focused on the effect of winter drainage of paddy fields on CH4 emissions.
Because of constant precipitation over the year and the need to preserve
water resources, it is common to flood paddy fields all year round
in the hilly areas of southwest China. However, this practice maintains
anaerobic conditions in the soil and is very likely to enhance CH4
emissions. The results of our experiment clearly showed that CH4
emissions during the fallow period from rice harvesting to transplanting
in the following year contributed to nearly half of the annual emission
from the field (Fig. 8). No-tillage treatment reduced the annual
emission by 33%. A dramatic effect was achieved by winter drainage
for cropping wheat: there were negligible CH4 emissions in the wheat
period in addition to the reduction in emissions in the rice period.
Winter drainage reduced annual CH4 emissions by 67%. Another field
experiment in Yintang, Jiangxi Province, focused on N2O emissions
from regional cropping systems of upland rice, oil rapeseed, and
beans. Emission rates of N2O were relatively low because of low soil
pH. Emission factors against applied nitrogen accounted for 0.13%,
0.22%, and 0.40% for upland rice, an oil rapeseed-peanut rotation,
and a broadbean-soybean rotation, respectively, suggesting that leguminous
crops contribute markedly to N2O emissions.
Our collaborative research with IAE focused on in situ measurements
of N2O and CH4 fluxes from temperate grasslands in northwestern China.
Two study sites - in the southwest of the Songnen Plain, Liaoning
Province, and in the west of the Kerqin Steppe of east Inner Mongolia
- were monitored for N2O and CH4 fluxes from 2000 to 2002. The results
showed that the 2 temperate grasslands were sources of N2O. N2O fluxes
averaged over the 3 years at the Songnen and Kerqin sites were 27.1
and 5.4 mg N m-2 h-1, respectively. The two grasslands were also
identified to be sources of CH4, but the flux varied greatly among
years. A trade-off between N2O and CH4 emissions was observed with
variations in the water regimes of the fields.
In 2003, a new project that focuses on developing technologies to
mitigate CH4 and N2O emissions from agricultural ecosystems was initiated
as part of our continued collaboration with these 2 Chinese institutes.
Two field experiments - in Yixing, Jiangsu Province, and Shenyang,
Liaoning Province (Fig. 7) - are studying the effects of fertilizer
and crop residue management on CH4 and N2O emissions from cropped
fields. (K. Yagi, S. Sudo, H. Akiyama, and S. Nishimura)
|
| 4) Food Production Prediction Team
|
The mission of the Food Production Prediction Team is to assess
1) the impact of global environmental change on food production and
2) the efficacy of technologies designed to mitigate adverse environmental
changes. Major research domains are assessment of the impact of global
warming on agriculture, monitoring and modeling of environmental
changes in agricultural ecosystems, development of regional climate
change scenarios, and assessment of variability of climate systems
in Asian Monsoon countries. This year, all 14 researchers on the
team went abroad for field surveys or presentations at international
conferences. The team hosted 7 guest scientists from overseas and
accepted 2 students from domestic universities.
The following 3 activities were initiated in FY 2002: 1) prediction
of changes in agricultural productivity in light of responses to
global warming, 2) development of risk assessment techniques for
agro-ecosystems, considering the variability and regionality of its
influence, and 3) construction of a model and development of regional
estimation techniques for space-time changes in soil carbon flux.
The following 5 activities were completed this fiscal year: 1) detection
and evaluation of environmental disasters by using microwave sensor
data and global information systems, 2) studies of the feedback effects
on the atmosphere of terrestrial ecosystem change under global warming,
3) global mapping of carbon-derived products in terrestrial ecosystems,
4) modeling of the carbon circulation process in terrestrial ecosystems,
and 5) assessment of the carbon balance in a paddy field ecosystem
in terms of dissolved carbon fluxes and their stable carbon isotope
ratios.
Ongoing activities are: 1) development of advanced techniques for
projecting future climate change by using ocean-atmosphere-coupled
global climate modeling (GCM) and statistical methods, 2) prediction
of the impacts of climate change on food supplies, 3) analysis of
the hydrological cycle and its variability in Asia, 4) evaluation
of the impact of global climate change on soil environments in East
Asia, 5) development of an index for evaluating the environmental
resource changes occurring with desertification in China, and 6)
study of the distribution and patterns of fluctuation of agricultural
water resources.
Topic : Evaluation of vulnerability
of cereal crop production in China under climate change and climate
variability
Agricultural production is primarily regulated by the availability
of natural environmental resources such as temperature, radiation,
surface water, and soil fertility. The spatial distribution of available
resources determines patterns of cultivation areas and croplands.
Climate change and the associated climate variability are very likely
to have major impacts on the hydrological cycle and consequently
on available water resources, flood and drought potential, and agricultural
productivity. Asian countries, which rely traditionally on highly
water-consuming cultivation systems such as paddy rice crops, are
very vulnerable to variations in water resources (Thomas 2000). In
China, which has the world's largest cropland area and population,
water is the most critical resource.
We explored the changing trends in agricultural water demands and
variability in soil moisture associated with both drought and increased
surface runoff in Chinese croplands during the last half-century
(1946-95) and their impacts on agricultural production. We plotted
temporal and spatial changes in agricultural water demands, soil
moisture, soil-moisture variability, soil-moisture deficit, yield
index, and surface runoff on a grid of 0.5-degree resolution using
a simple water budget model. The same analyses were also done under
future climate change, using interpolated climate change scenarios
(2031-65) based on the HadCM2 GCM.
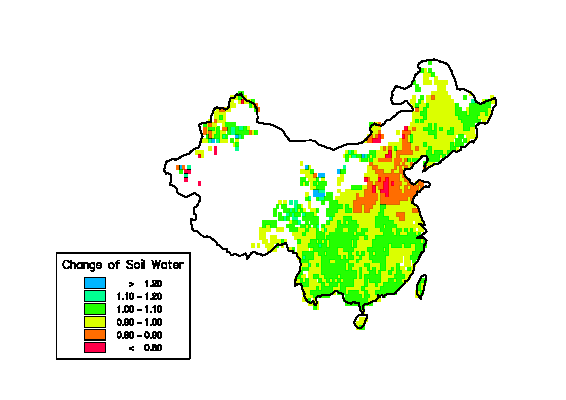
We found a trend toward increased agricultural water demand and
increased soil drying, as well as significant changes in soil-moisture
variability, on the North China Plain and the Northeast China Plain
(Fig. 9). There was a significant decrease in agricultural water
demand and a significant increase in soil-moisture levels in southwest
China, and generally insignificant increasing or decreasing trends
in agricultural water demand and soil-moisture levels in southeast
China (Fig. 10). These changes in agricultural water demand and soil-moisture
levels had corresponding impacts on soil-moisture deficit, and consequently
on agricultural production. Increased surface runoff was found in
the mountainous areas of the southwest and northeast, and in some
areas along the south coast.
Under the projected climate change, it was predicted that the suitability
of early rice cultivation would decrease owing to surface water shortages,
especially in southern China. The suitability of winter wheat cultivation
was, however, predicted to increase in the Northeast China Plain.
For maize cultivation, suitability would slightly decrease in the
same region. Changes in cropland suitability would bring about changes
in cropping systems and would consequently result in land-use change.
As a next step, such vulnerability evaluation studies should focus
on specific areas within the region where higher vulnerability has
been evaluated. For example, we will examine some small river basin
areas on the North China Plain and the Northeast China Plain and
will conduct an integrated evaluation using process-based crop growth
models. (M. Yokozawa and F. Tao)
|
| 5) Ecosystem Gas Exchange Team
|
To investigate seasonal and inter-annual variations in carbon and
energy exchange between agricultural ecosystems and the atmosphere,
the Ecosystem Gas Exchange Team conducts long-term observations of
gas and energy fluxes at 3 sites: a single-cropping rice paddy field
in central Japan, a natural wetland in eastern Hokkaido, Japan, and
a wet sedge tundra at Barrow, Alaska. This study is closely related
to AsiaFlux, which utilizes tower-based observation sites of carbon,
water vapor, and energy exchange between terrestrial ecosystems and
the atmosphere in Eastern and Southeastern Asia as part of worldwide
network, FLUXNET. At each of our 3 observation sites, we are measuring
fluxes of carbon dioxide (CO2), methane (CH4), water vapor, and sensible
heat by using the eddy covariance method, along with standard measurements
of meteorological and ecological variables. Intensive experiments
are conducted during growing periods, but some key measurements are
continued without a break throughout the year because gas and energy
exchange between soil and the atmosphere continues during post-growing
periods as well.
A unique feature of our observations in AsiaFlux and FLUXNET is
that we are measuring CO2 and CH4 fluxes simultaneously. Both fluxes
are important components of the carbon and greenhouse gas (GHG) budgets
of wetland ecosystems. To realize long-term continuous measurements
of CH4 flux in fields, we developed a micrometeorological method,
in which the CH4 concentration gradient measured with an FID (flame
ionization detector) gas analyzer is combined with the eddy diffusivity
determined with a sonic anemometer. This method is being used successfully
at the 3 sites.
In addition to the flux measurements, we began studies of the processes
of CH4 and CO2 exchange in paddy fields by utilizing stable isotopes
from the 2002 growing season. The results of these isotopic measurements
will be combined with those of gas flux measurements and will provide
us with invaluable information on CH4 and CO2 budgets, such as oxidation
rates of CH4 in the soil or the partitioning of CO2 flux into photosynthesis
and respiration rates. The data accumulated in the observation are
integrated into the Ecosystem Database, which was jointly developed
by NIAES and Japan Science and Technology Corporation, and will be
accessible to the public at http://ecomdb.niaes.affrc.go.jp .
Topic: Annual exchange of CO2 and
CH4 between wet sedge tundra in
the Alaskan Arctic and the atmosphere
As a result of increasing concentrations of
GHGs in the atmosphere, temperature rises are predicted to appear
first in the Arctic. These temperature rises, in turn, affect GHG
exchange between terrestrial ecosystems in the Arctic (tundra)
and the atmosphere through the increased activities of plants and
microbes. To assess the influence of climatic variations on GHG
exchange between tundra and the atmosphere, and to predict future
changes in the GHG budget in the ecosystem, we conducted a joint
Japan - United States study in the Alaskan Arctic between 1999
and 2002, with the financial support of the then Science and Technology
Agency of Japan and the Ministry of Education, Culture, Sports,
Science and Technology of Japan. In collaboration with San Diego
State University and the International Arctic Research Center at
Fairbanks, Alaska, we performed long-term tower-based measurements
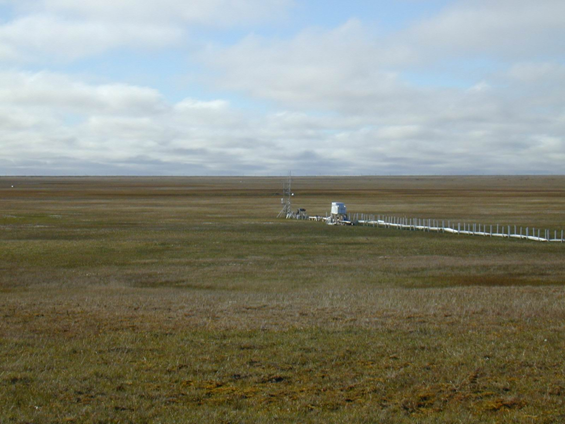
of CO2 and CH4 fluxes on the arctic tundra at Barrow (71°19 ' N,
156 ° 37 ' W, 1 m above sea level). The observation site (Photo
1)
is categorized as wet sedge tundra, and the vegetation consists of
wet sedges, grasses, mosses, and lichens. The growing season starts
immediately after snowmelt in mid-June and lasts until the end of
August or late September, depending on the weather in any given year.
Thaw depth (depth of the active layer, which lies above the permafrost
and melts in summer) reaches about 30 to 35 cm late in the growing
season. The observation site is flooded after snowmelt and partly
inundated, even in mid-summer. The inundated tundra, like the Barrow
site, occupies about 25% of the total tundra area in the world.
The tundra ecosystem assimilates CO2 through
photosynthesis in summer (gross primary production; GPP), whereas
it releases CO2 through plant respiration and decomposition of
organic matter in the soil (ecosystem respiration; RE). CO2 fluxes
in summer, as measured by the eddy covariance method, were partitioned
into GPP and RE by determining RE as an empirical function of temperature.
By accumulating half-hourly fluxes, we calculated the annual budgets
of CO2 and CH4 (Fig.
11). In the annual budget of CO2, the sum
of RE occupied 20% to 30% of the GPP, and the remaining part of
the GPP was accumulated into the tundra ecosystem as net ecosystem
production (NEP). NEP at the site was larger than previously reported
NEPs for wetlands in high latitudes, presumably because water overlying
the soil regulated CO2 diffusion from the ground and consequently
reduced RE. NEP in 1999 was twice as much as in 2000 and 2001.
These year-to-year variations of CO2 budget are primarily caused
by differences in GPP, because GPP is dependent on the meteorological
conditions in each year. With regard to the CH4 budget, most emissions
occur in summer, but a small amount of CH4 is released in early
winter, when the surface soil temperature is around 0 ° C. The
largest CH4 emission was observed in 1999, together with the largest
GPP, implying a close relationship between CO2 assimilation and
CH4 emission.
From the budgets of CO2 and CH4 and the meteorological data, we
estimated the annual exchange of GHGs at the site in a year when
air temperature and precipitation were close to their long-term averages
(Fig. 12). The annual NEP (= GPP - RE) was 80 g C m-2 y-1, whereas
the amount of CH4 emitted was 4% of the NEP and could be neglected
in the carbon budget at the site. However, the CH4 emitted was equivalent
to 34% of NEP when we considered the global warming potential with
a time horizon of 100 years. The present wet sedge tundra thus works
as a sink of GHGs, but one-third of the net CO2 assimilation is compensated
by CH4 emission. Further studies, including integration of observation
data and modeling, are needed to predict future changes in the GHG
budget of the ecosystem under global warming. (A. Miyata)
|
|
|
|