 |
||
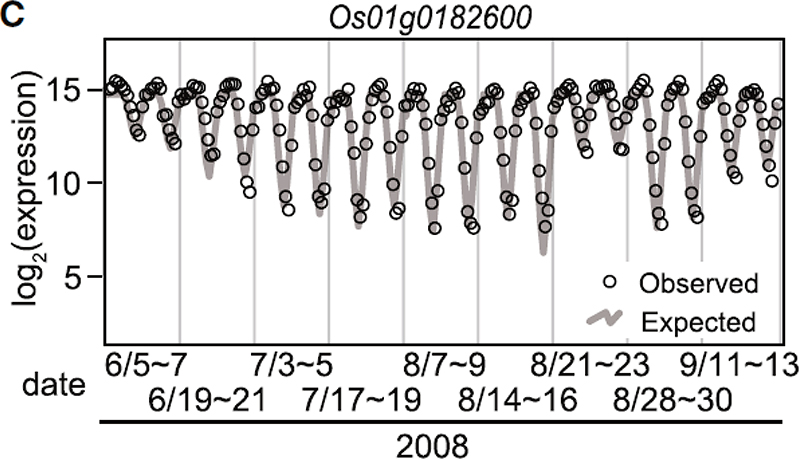
| Fig.1. Expression of Os01g0182600. Expression in samples from June to September 2008. Samples were obtained at 2 hr intervals for a 48-hr period in nine data sets. |
 |
||
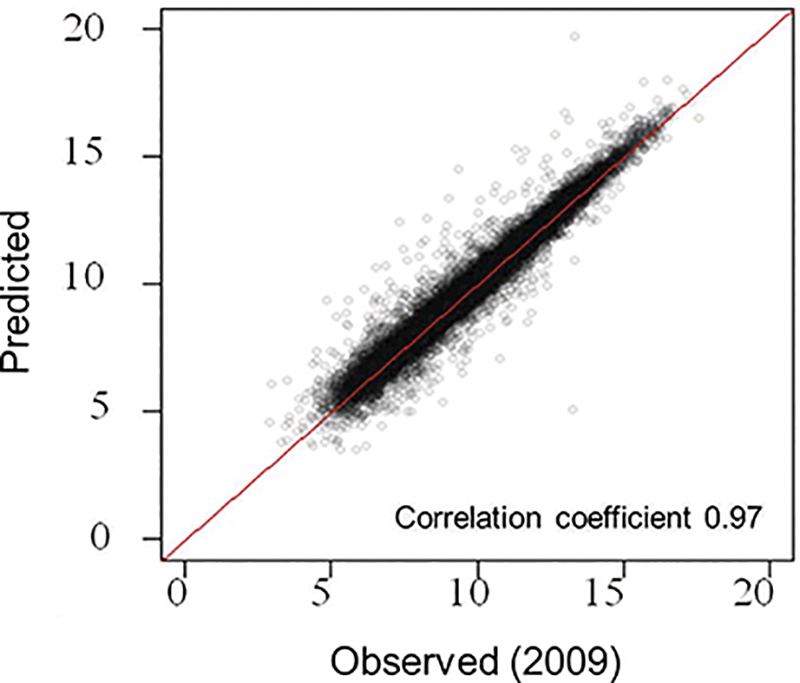
| Fig.2. Scatterplot of observed vs. predicted transcriptome at a sample in 2009 in the field. A high correlation was obtained across all genes between the predicted transcriptome based on the 2008 statistical model with the meteorological data and transplanting data in 2009 and the observed transcriptome data from a sample obtained in 2009. |